Business of Building 2026: Bubble Shipped Monetization Data, Not Product News
Bubble published behavioral data from 250k+ apps: 31% charge on day one, ~45 deploys in six months, AI features monetize 28% vs 10%. Here's what works as a discipline checklist, and why it is not an industry benchmark.
Short version: on 2026-09-08 Bubble published 'The Business of Building 2026' — a blog post plus an interactive report. It is not a feature announcement and it is not part of the current agent/MCP news cycle. It is behavioral analytics of Bubble's own platform. For an indie developer there are a few concrete numbers, one usable discipline template, and one solid reason not to treat any of it as an industry benchmark.
What the dataset is
- 250,000+ live/deployed apps, 11.9M deploys, 233M edits.
- Each app tracked for its first six months from launch.
- Source is observed activity (deploy / edit / payment events), not a survey. That is a real advantage: people misreport revenue in surveys, logs do not.
- The typical app reaches first deploy in about 3 days. Bubble's own framing: launch speed alone does not predict revenue.
The four habits of apps that 'make money'
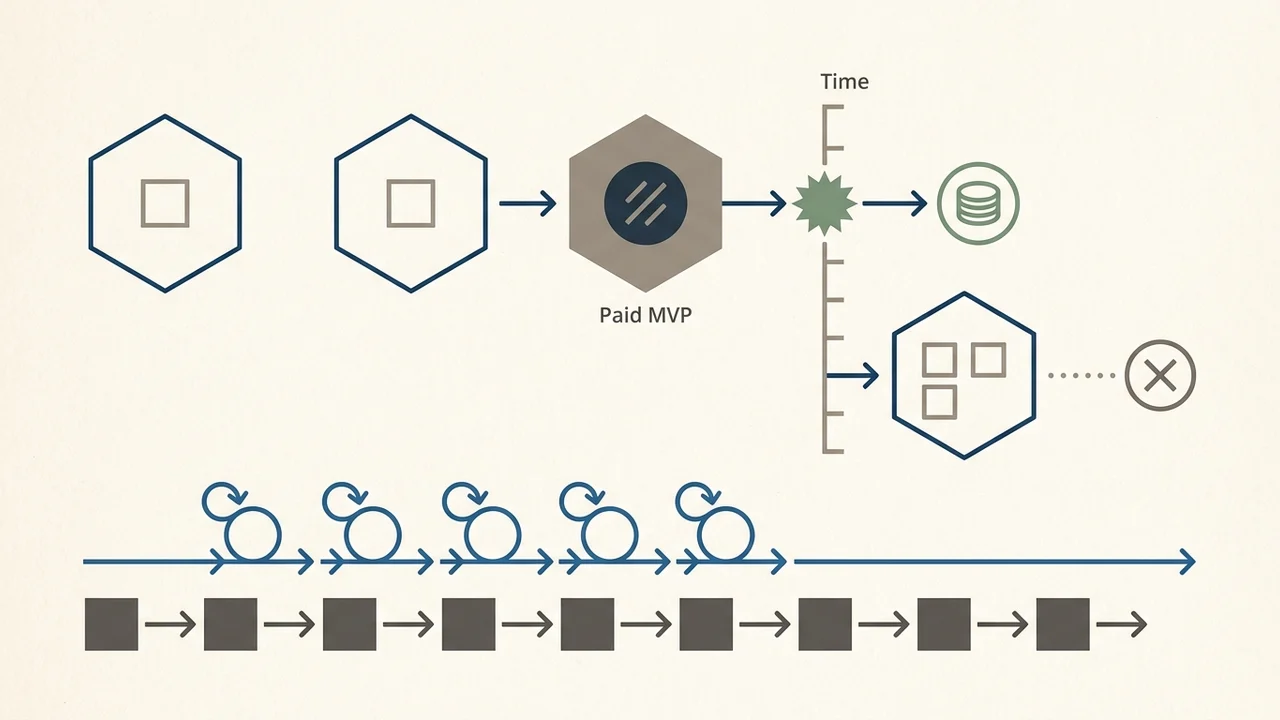
1. Charge early. About 31% charge on day one (that figure appears in meta/OG text; the body copy softens it to 'almost a third'). Median first transaction lands within 8 days.
2. Ship steadily. ~45 deploys over six months versus ~2 for non-monetizing apps — roughly 20x.
3. Keep editing. ~614 edits across ~46 active days versus ~25 edits across ~4 days: about 25x the edit volume and 12x the active days. Longest uninterrupted build streak is ~9 days versus ~2.
4. Add expected / high-risk features. Apps with AI features monetize at 28% versus 10% for apps without.
The post closes with Bubble's positioning argument — long-term iteration requires understanding and editing what you built, an implicit contrast with opaque generated code — plus a signup CTA.
What the data does not prove
If you plan to quote any of this, carry the caveats with it:
- Single-vendor dataset. Bubble is analyzing its own platform. No independent replication or third-party audit appears in the public sources available for this piece.
- Correlation, not causation. 'Charge early leads to success' is an inference drawn from observational data, not an experiment. Builders who ship pricing in release one are probably different in many other ways too.
- Survivorship and selection bias. The 'live and deployed' filter removes abandoned experiments, and the Bubble cohort is not a stand-in for indie SaaS generally.
- The AI gap may be about something else. 28% versus 10% could reflect builder seriousness or product category (B2B) rather than AI itself. The post acknowledges AI cost and variability trade-offs and still recommends adding AI.
- Key definitions are missing from the post. What counts as 'makes money' — any payment, recurring revenue, or a threshold amount? What is the monetization base rate across all 250k apps, not just among monetizers? Were comparisons controlled for app age, category, or plan tier? The blog does not answer these.
- I did not verify the full report. The report landing page is a Bubble SPA; its methodology, builder demographics, and predictions are referenced but not extractable as static text. If you cite demographics or predictions, label them unverified or check them yourself in a browser.
- Marketing intent. The post ends in a signup CTA and 'stay in control' positioning. Treat it as platform-anchored guidance, not a neutral market benchmark.
How to actually use it
Not as a benchmark — as a discipline checklist, because the habits themselves are sound regardless of how strong the dataset is.
- Put pricing in MVP scope, not 'phase 2'. One paid plan and a working payment flow in the first release. Even if the price is provisional, a payment is the only reliable signal that someone needs the product. A target like 'first transaction within 8 days of deploy' is realistic.
- Treat deploy cadence as a process metric. ~45 deploys in six months is roughly 1–2 per week. That is not a heroic pace, it is a minimum pulse. A week with no deploy is a signal, not a normal week.
- Streaks beat sprints. The widest gap in the data is not total work, it is active days (~46 versus ~4). Two hours daily beats a monthly weekend marathon.
- Add AI where users expect it, with a budget. If you ship it, plan cost per request, timeouts, a non-AI fallback path, and spend logging. Otherwise the 'AI feature' becomes a support-ticket generator and an unpredictable invoice.
- Track your own numbers. Days to first payment, deploys per week, active build days per project. In three months your own log will be more useful than any vendor statistic.
Honest takeaway
This is not product news, and it should not be dressed up as product news. It is a vendor report whose correlational findings happen to line up with ordinary engineering discipline: charge early, deploy often, do not disappear for a month, and do not add AI without budgeting for it. Use the numbers to tune your own process, not as evidence in an argument about the market.
Sources
- https://bubble.io/blog/business-of-building-2026/ — primary source, published 2026-09-08, all figures cited above.
- https://bubble.io/the-business-of-building — full report landing page (SPA; contents not verified for this piece).